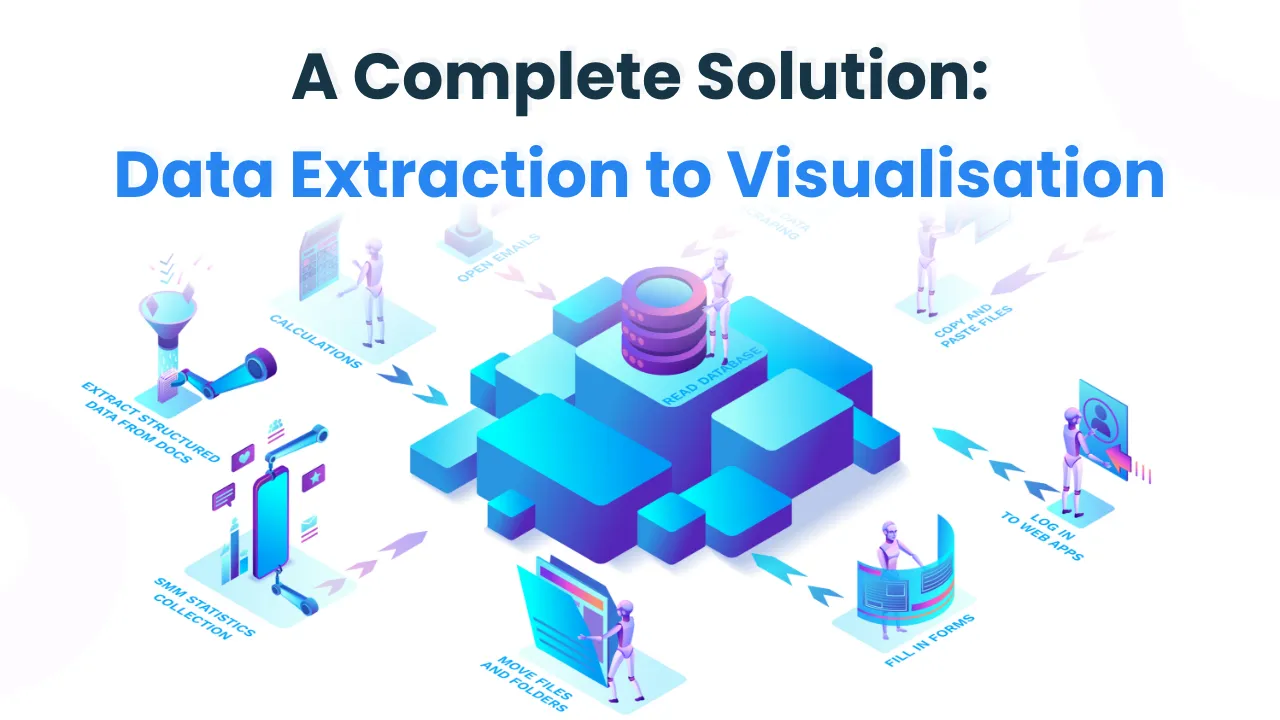
Data is the driving force behind every business. However, to seize the information advantage and use data as a decision-making resource, businesses must leverage the power of both structured data (contained in relational databases) and unstructured data (trapped in documents, spreadsheets, email messages, machine logs, and other data sources).
Industries face a lot of problems in their day-to-day operations, and traditional methods of analyzing data are one of the main reasons. They don’t realize that now might be the best time to adapt to new ways, leaving the old-school techniques behind. Companies gather a lot of data during their operations. However, these big data sets are unstructured, and raw, and do not pose any viable means that can benefit the company.
Moreover, the business environment is a dynamic environment and thus, full of uncertainty, it particularly makes it harder for companies to form strategies that can benefit them in the long run.
However, with the ever-evolving technology now at our disposal, companies can use advanced analytics, big data solutions, and power BI consulting services to extract valuable information from the heap of unprocessed data.
The most common and efficient way of data extraction is done with the help of a process called ETL. ETL or Extract, Transform, and Load (ETL) is a process that extracts, transforms, and loads data from numerous sources to a data warehouse or a cooperative data repository. This data is collected centrally in the repository, making it easier to examine further and handle the information.
To put the importance of data extraction in context, it's helpful to briefly consider the ETL process as a whole. There are three steps in the ETL process.
Extract: Data is taken from one or multiple sources or systems. The extraction discovers and pinpoints relevant data and then prepares it for processing or transformation. Data extraction allows many different types of data to be combined and ultimately mined for business intelligence (BI).
Transform: After the successful extraction of data, the next stage is to refine it. During the transformation process, data is sorted, organized, filtered, and cleansed to ensure its reliability and authenticity. For instance, eliminating duplicate entries, removing missing values, and performing audits to produce data that is reliable, consistent, and usable.
Load: The loading stage is the final stage, where the transformed data is sent from the staging area to the target data warehouse. This step entails an initial load of all data, followed by recurrent loading of incremental data updates and, less frequently, complete refreshes to wipe and replace data in the warehouse.
Variety alludes to the diversity and degree of different data types, sources, and nature. It includes unstructured data, semi-structured data, and raw/unprocessed data. The data sources might be in the form of photos, videos, text files, PDFs, spreadsheets, and databases.
After knowing the ETL process and how it works, the next thing you will want is a robust ETL tool that can perform all of the above functions spectacularly.
Kockpit Nucleus provides a user-friendly environment for big data analytics and ETL functions via one-click integrations with necessary ETL tools. Kockpit Nucleus is the ideal tool for every developer as it supports Hadoop clusters, Linux and Windows terminal interaction, database integration, and other helpful features.
Kockpit Nucleus maintains mountains of data sets transmitted from several data pipelines. It automates all data changes and prevents any data loss that might occur from manual data processing.
ETL tools and visualization with Power BI deliver reliable and authentic insights through intuitive dashboards. These dashboards can be personalized according to the different departments or functions of a business.
Sales: The sales dashboards include all aspects and information that the sales manager might need to make critical changes in the sales strategies.
Finance: The finance dashboards consist of KPIs such as profit generated, target vs. actual revenue, and Revenue growth percentage, among many others.
Inventory: Inventory management can be a hassle, and Kockpit dashboards deliver specific KPIs for inventory management. It includes stock trends, stock aging by product group, and DSI with buckets.
Production: The production dashboard includes KPIs such as Downtime Analysis, production summary, and pending over status.
So, to put it simply, there is more to ETL tools and the benefits one might be able to leverage with its help than one can think of.
Data extraction and data visualization provide a comprehensive and holistic view of your business and all business functions. Kockpit Nucleus is an advanced ETL solution that is fully capable of processing your raw data and delivering clean, reliable, and fool-proof insights without any manual intervention.
With this article, we hope you got an insight into data extraction through ETL tools and data visualization with Microsoft Power BI. To get your own customized ETL and visualization tool, you can contact us and get a free consultation.
Discover the most interesting topic