Contact Us

Kockpit is here to help you

Business Form

Kockpit
Business Suite

Manage your business better and smarter!

Kockpit Business Suite is a package of pre-defined dashboards built on Microsoft Power BI covering all the popular domains such as Sales, Account Payables, Account Receivables, Production, Inventory, and Finance.

Features Of Business Suite

Built on Microsoft Power BI

Connect to any type of data source you want, including data from any app or services, reports, cloud-based sources, workbooks, CSV files, Excel, or databases.

Pre-designed Dashboards

Cover all the popular domains such as Sales, Account Payables, Account Receivables, Production, Inventory, and Finance using the Business Suite reports.

Manage your Data

Business Suite comes with multiple functionalities like role-based authentication and row-level security to control who views your data and also the availability of both Real-Time and Scheduled Refreshes for data tracking.

Data Security

In addition to the built-in security controls of Power BI, Business Suite also comes equipped with networking security, risk mitigation, session monitoring, authorization, and cloud-based security provisions.

Key Modules of Business Suite

Sales

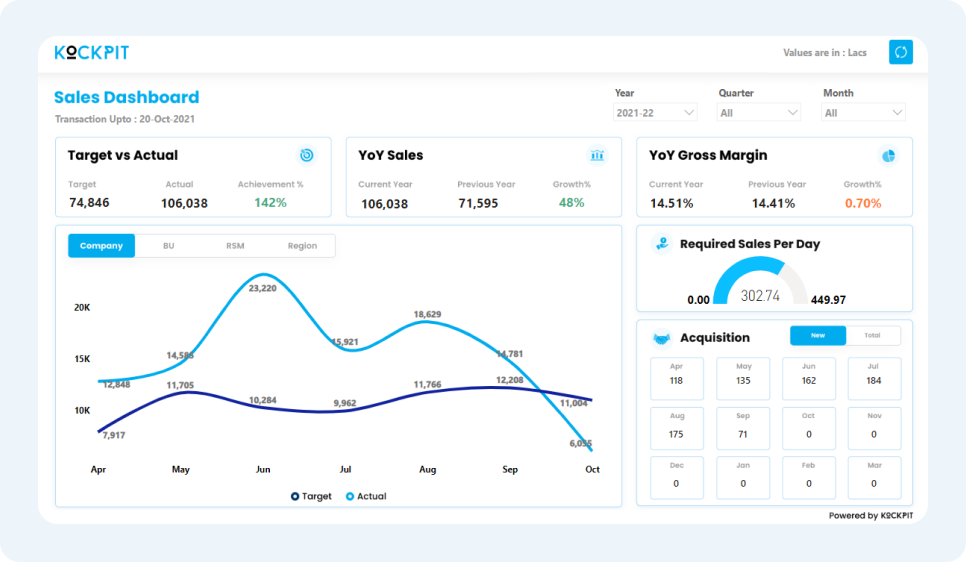
A sales dashboard is a tool that enables executives and managers to effectively control sales KPIs and monitor them in one central place while helping teams to reach sales goals through detailed analyses of sales performance. Sales departments need to have strong ownership of their pipelines, data at their fingertips, and accurate information at any given point in time.

Some KPIs in the Sales Module include

  • Customer wise sales
  • Inactive customers
  • Customer Profile
  • Sale trends for the last 12 months
  • Salesperson Profile
  • Active customers
  • Customer scorecard
  • New customer sales
  • Salesperson scorecard
  • Gross margin % of total revenue
  • Product scorecard

Accounts Payable

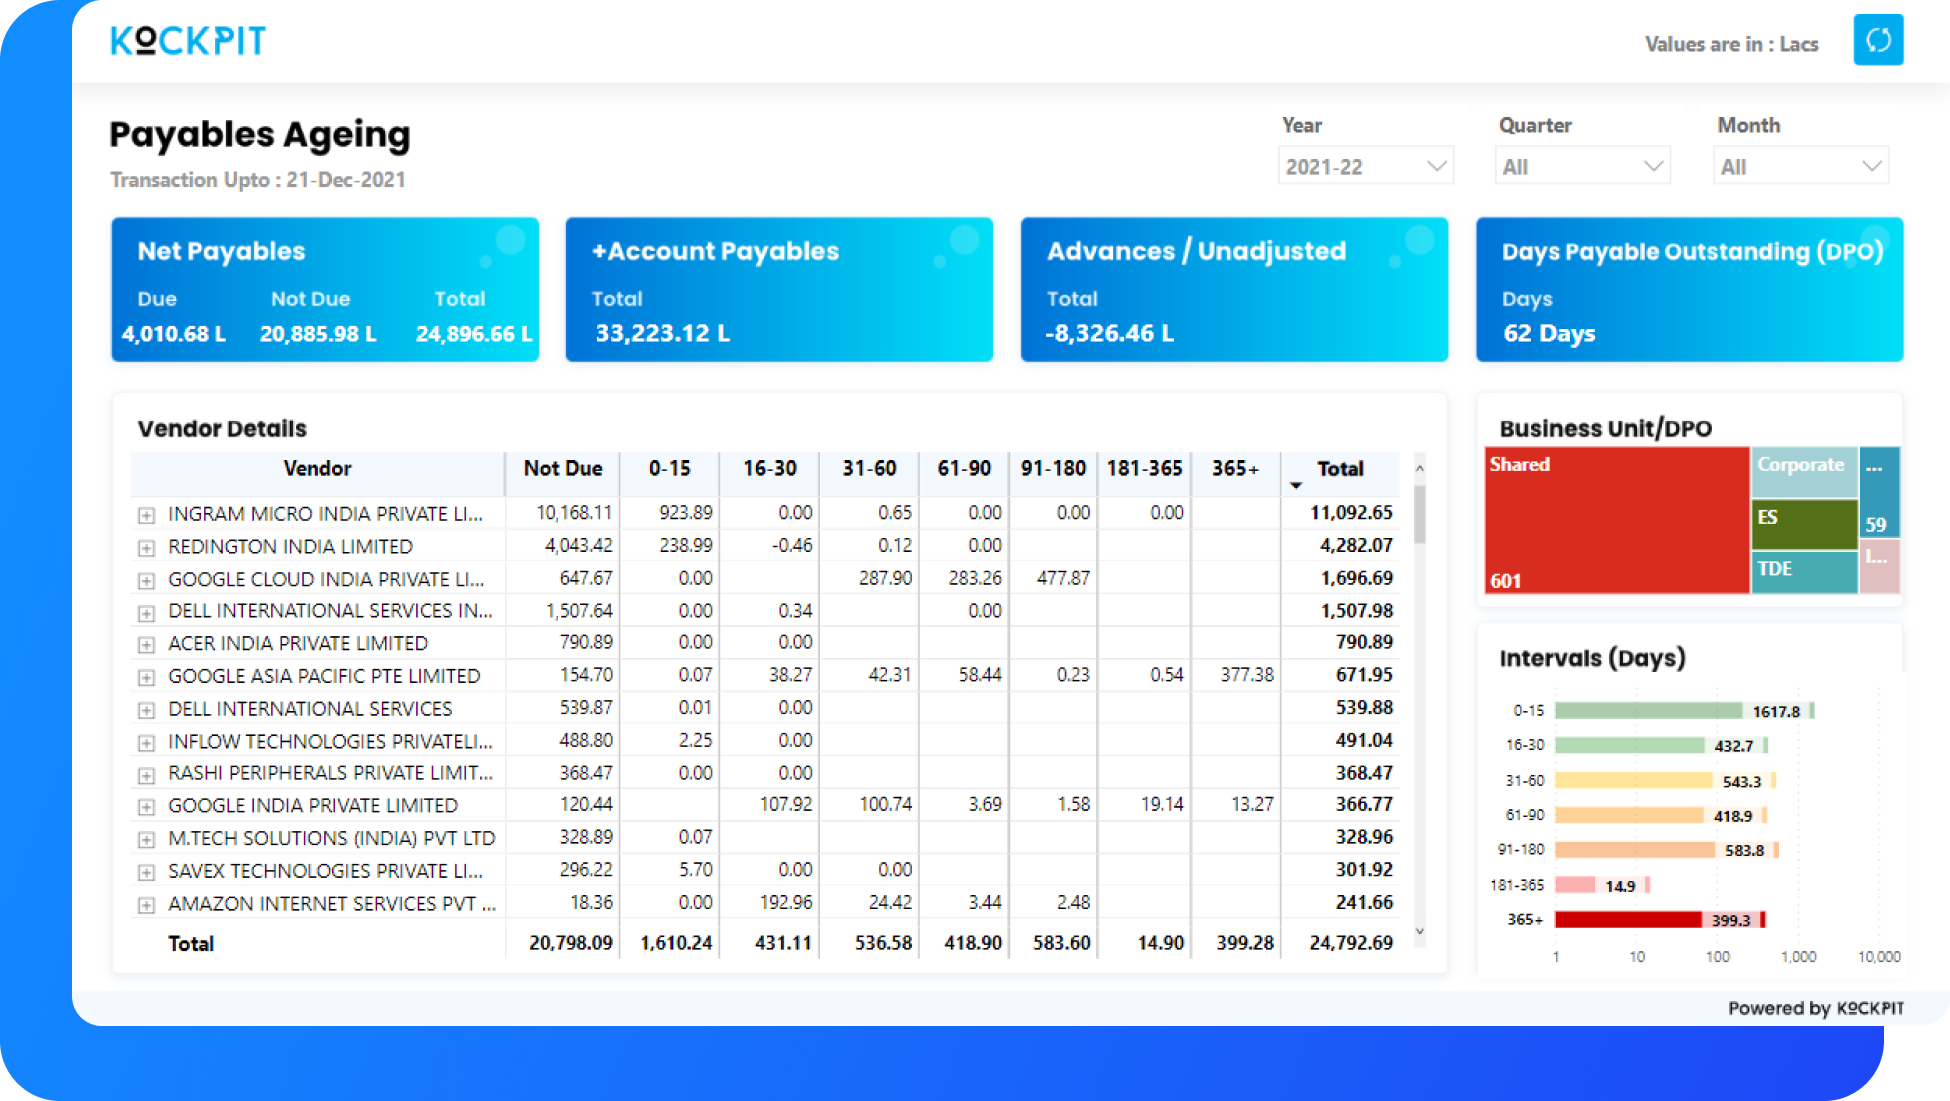
The accounts Payable Analysis dashboard provides insights that help organizations to streamline workflow automation and strategies for efficient invoice processing and accounts payable process. It helps the personnel to evaluate the accounting and outflow of cash in the organization and also come up with strategies to improve the effectiveness and efficiency of processing.

The Accounts Payable dashboard generates a summary of invoice aging. Generally, one of the more popular AP reports shows where invoices are in the payment cycle. Ideally, this dashboard can help companies both pay their invoices on time and within windows.

Some KPIs available in the Accounts Payable Module are as below

  • Vendor wise DPO
  • Purchaser wise DPO
  • Payables v/s DPO
  • DPO (aging buckets)
  • Advance paid
  • DPO trends
  • Top/ bottom N analysis

Accounts Receivables

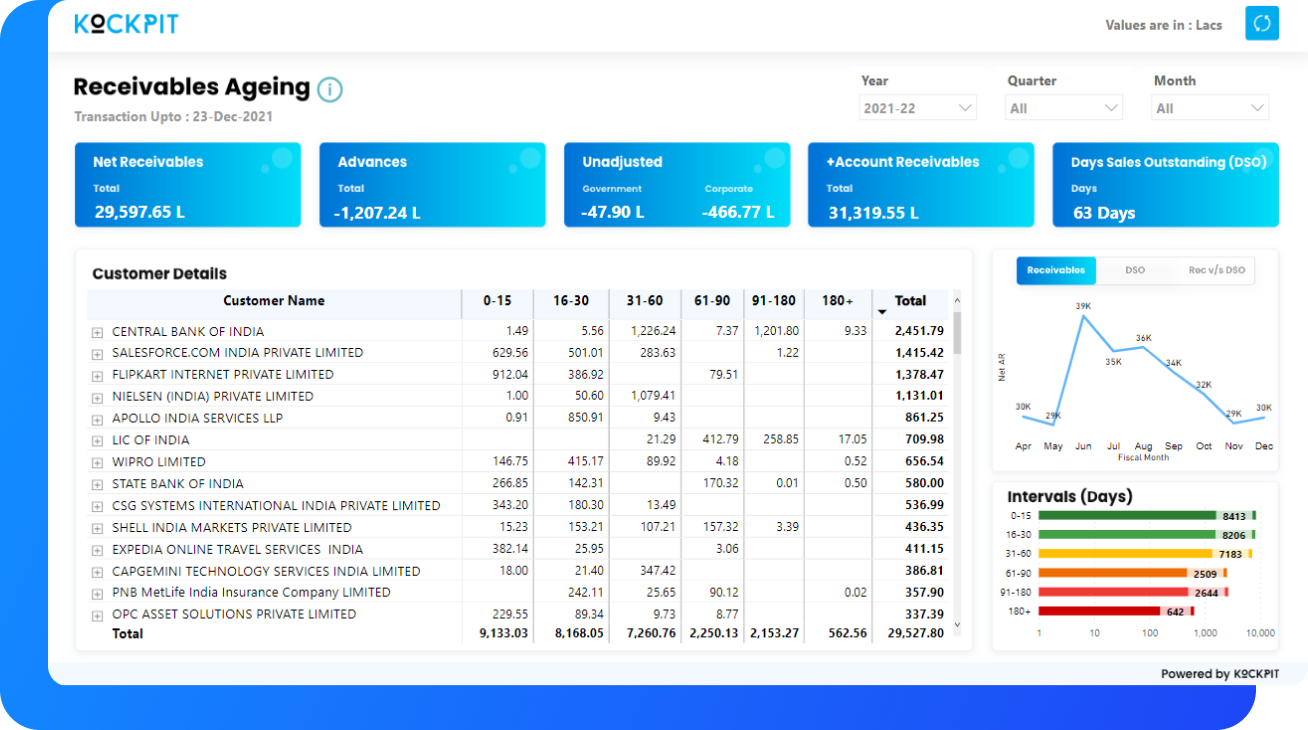
Accounts receivable dashboards offer a window into everything that matters with A/R. Users can quickly reference key metrics, see updated data, and immediately understand the positives and negatives of performance. Account receivable takes care of the pending receivable amount for the services and goods provided. Bucketing and further segmentation based on risk factors and analysis help to identify the gaps.

Following are some of the KPIs in the Accounts Receivables Module

  • Total AR
  • Salesperson wise pending AR
  • Pending Amount by Receivables Age
  • Top / Bottom N customers by customer
  • Advance paid
  • Receivables v/s DSO
  • The pending amount by customer name

Inventory

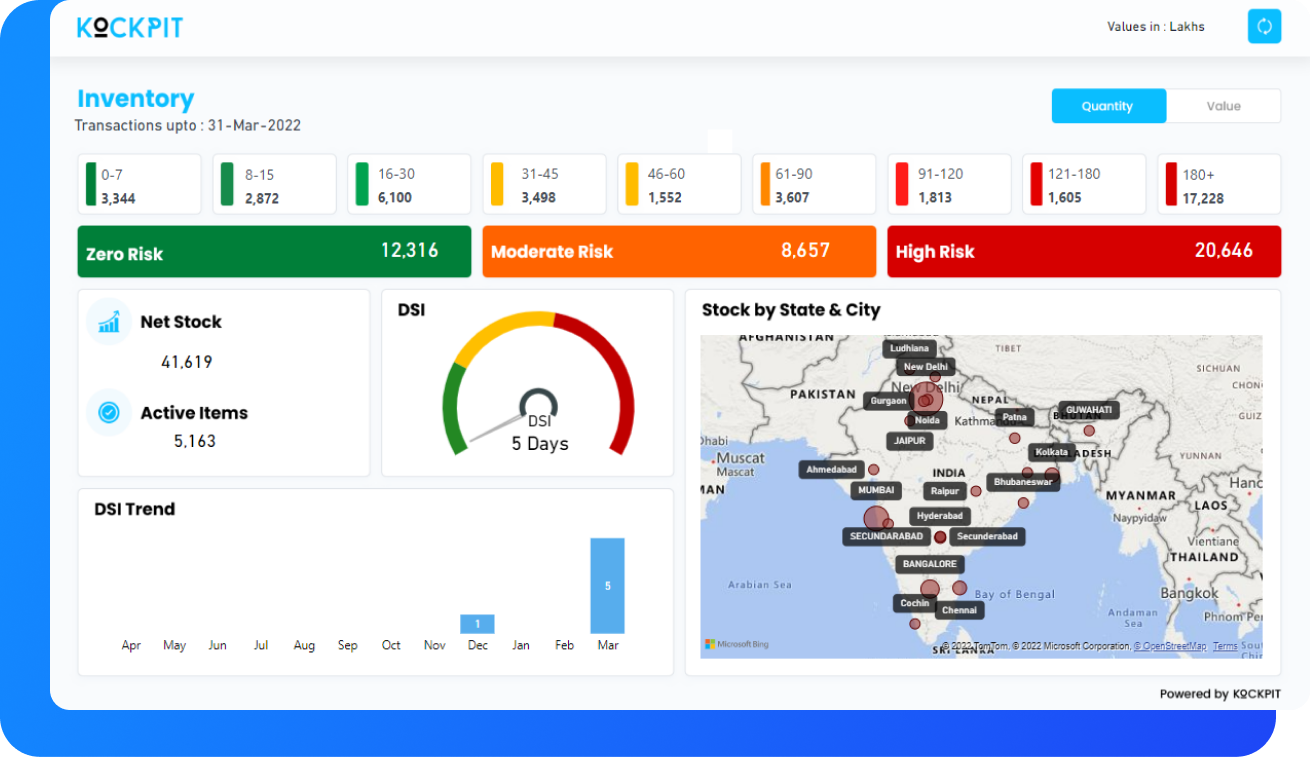
The inventory dashboard proactively monitors inventory levels helping organizations create future inventory plans. The inventory module provides useful info for stock availability with the company and its aging. Buckets with their color codes help to identify the level or status of the stock in monthly, quarterly, and yearly reports.

Some important KPIs in Inventory Module

  • Stock aging by product group
  • Stock by location, name, and interval
  • Stock snapshots at each month-end
  • Categorization with aging
  • DSI with buckets (no of days range)
  • Inventory by location(warehouse/ other entities)
  • Stock trends

Finance

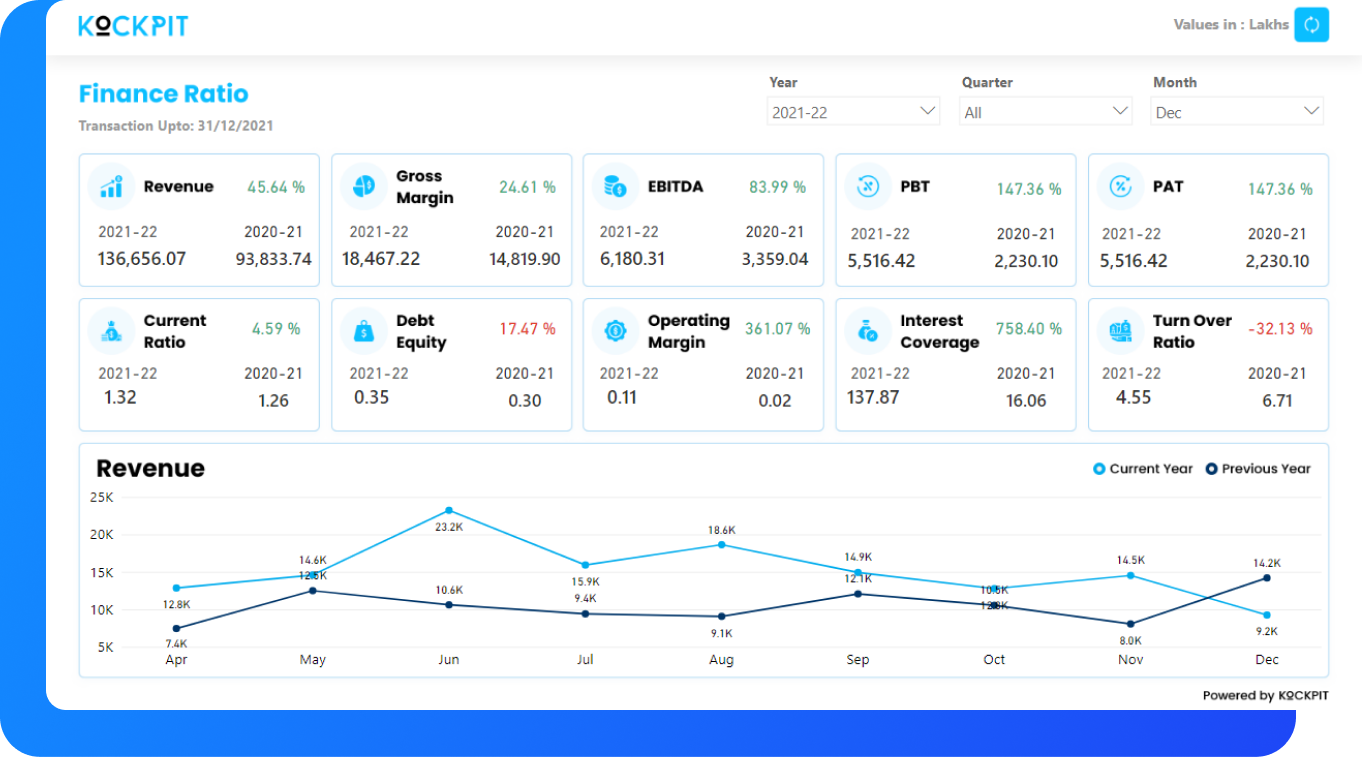
A financial dashboard is a management tool that helps to track all your relevant finance KPIs, allows for effective cash management, and enables you to track expenses, sales and profits in detail to meet and outperform the financial objectives of a department or company. They enable finance experts to validate figures faster and drill into financial details as much as needed, which increases productivity and, ultimately, provides a stable financial environment.

Some important KPIs in Finance Module

  • Revenue growth %
  • Variance %
  • Gross margin growth%
  • Balance sheet
  • PBT growth %
  • MIS PNL (Transaction Table containing every detail)
  • Profit loss statement
  • Direct and indirect expenditure trends
  • CY revenue
  • PY revenue

Production

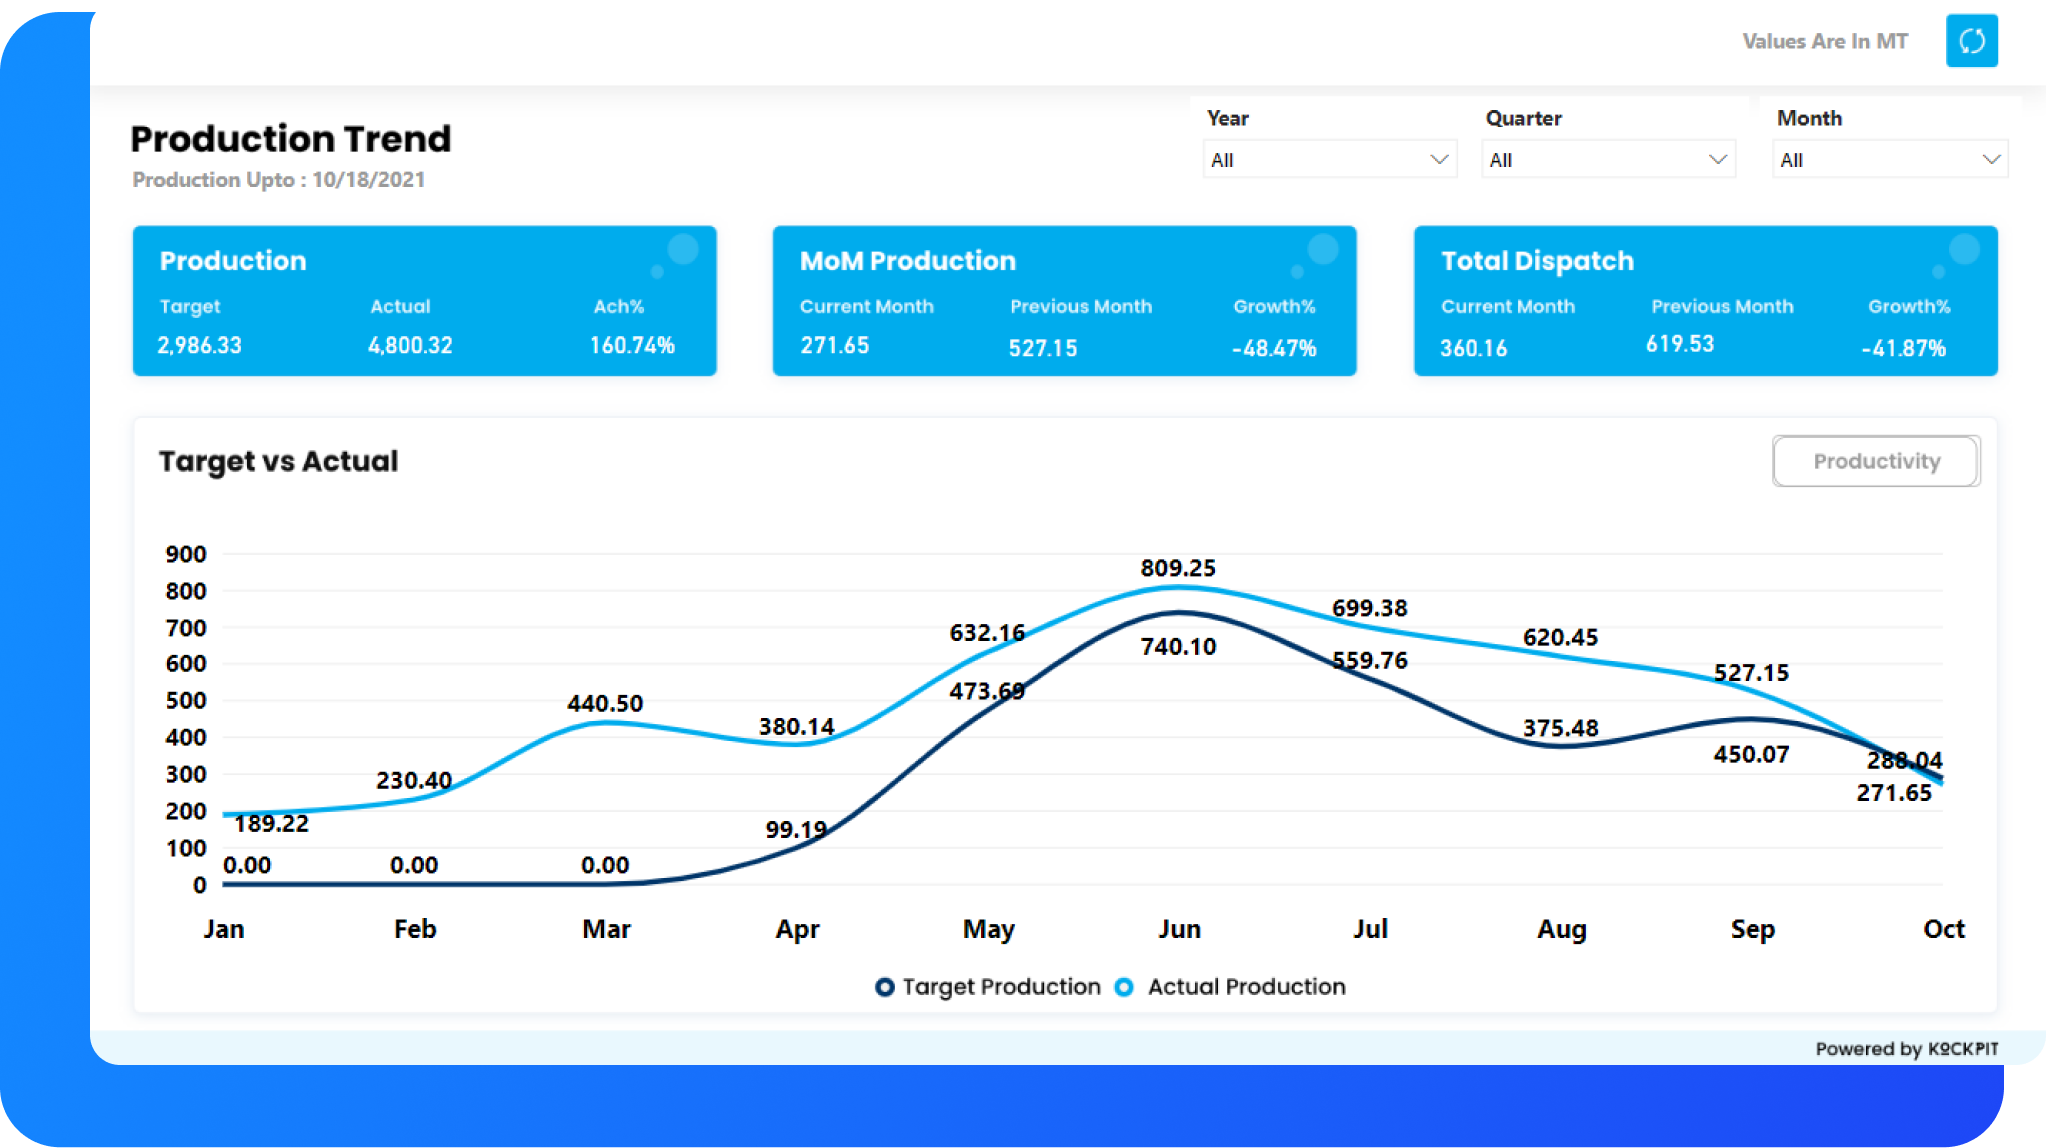
A manufacturing dashboard helps to monitor the most important production KPIs in one central point of access. It enables manufacturers to track and optimize product quality and is a valuable analytics tool for managing all related manufacturing costs efficiently.From taking up the requirements/orders to transferring the finished product to the warehouse/market, the process of production has been taken care of at every point via the KPIs.

Some KPIs of the Production Module

  • Pending Order Status
  • Planned production achievement % (weekly, monthly, quarterly, yearly)
  • Processes by stop time
  • Downtime analysis
  • Top reasons for downtime
  • Production Summary
  • Top machine name by stop time
  • Rejection Analysis

Purchase

A procurement dashboard enables purchasing manager to efficiently track, evaluate, and optimize all acquisition processes within a company with the help of procurement KPIs such as the purchase order cycle time, supplier defect rate, and many more.

Some KPIs in Purchase Module

  • Periodic prices comparison
  • OTIF score
  • Open PO
  • Total paid v/s outstanding.
  • Closed PO
  • Item & purchaser-wise price variation
  • Item & vendor

Advantages of Kockpit
Business Suite

Plug and Play

Pre-designed Dashboards based on Core Modules of ERP.

Actionable insights on the go

Reports are highly interactive and dynamic and contain domain-specific KPIs for streamlining business processes.

Easy-to-use

Simple, fast, and enterprise-grade interface for data analysis and reporting.

Cross-Filtered Analytics

Visualization of KPIs across different functions of the business, giving a 360-degree view of all operations.

Fast Processing

Refresh visuals and tables quickly on the go with quick data processing capabilities.

Powerful Visualization

Availability of various chart options and self-service analysis capacity that provide easy personalization for the end user.

Frequently asked questions (FAQs)

What is Kockpit Business Suite

Business Suite is a data visualization and reporting tool developed by Kockpit Analysis which consists of pre-designed Power BI Dashboards based on Core Modules of ERP.

How can Kockpit Business Suite help me and my business?

Business Suite provides BI analytics and visualization layer for quick business insights across functions and removes the dependency on exhaustive manual analysis to identify process gaps. Also, enhanced visualization of data provides a quick look at lead & lag indicators.

How can data analytics be done using Dashboards?

Power BI Dashboards are ready for extensive modeling, custom development, and real-time analytics. Built on Power BI, the Business Suite comes with multiple tools like drill-down analysis, cross-filter analysis, drill through to the nth level of hierarchy available, etc., that help with business insights across all the operations.

Is it possible for me to add personalizations to the dashboards?

The Business Suite is powered with room for personalization as per the user requirements. Resizing, wireframing changes, UI design changes, the addition of new/more KPIs, etc., can be easily managed in the Business Suite environment.

Let's Co-create Your Success Story

Lets Talk