Unleash data's power, and watch your insights grow. With Tableau's visuals, your data takes flight, with Kockpit's support keeping your business in sight.
Get Started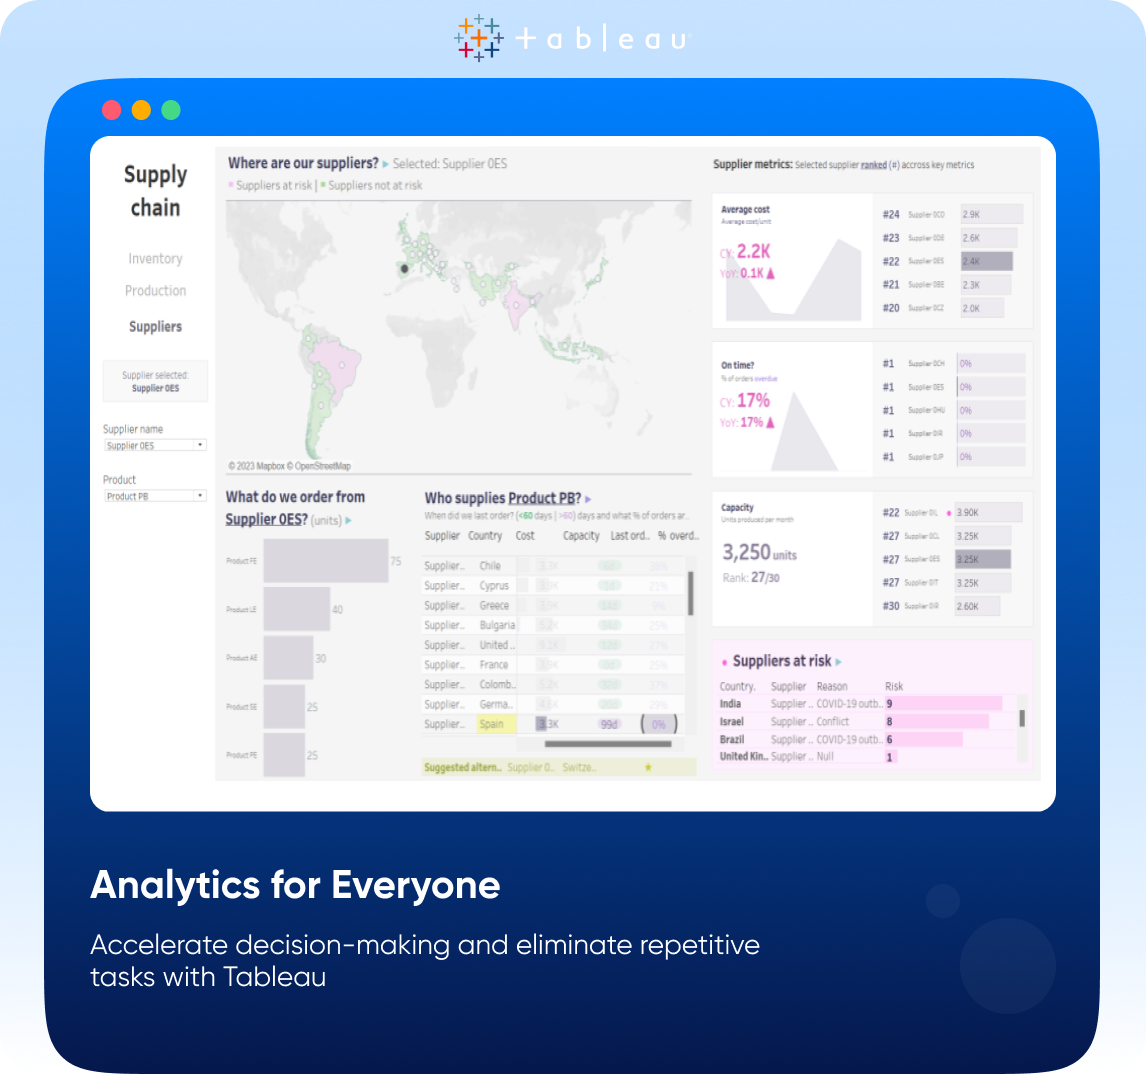


Tableau collaborates seamlessly, transforming raw data into actionable insights. Not only does it empower businesses to make informed decisions but also leads to driving success.
Learn MoreGet Started
Want a streamlined decision-making flow? You're just at the right place. Get visual analytics, and metrics, in harmony.

With Experts
Data & Analytics Consultants
BI Implementations for Fortune-100

Customer Satisfaction Rate


Our visual analytics platform is transforming the way people use data to solve problems. See our key features below to help you understand more about tableau

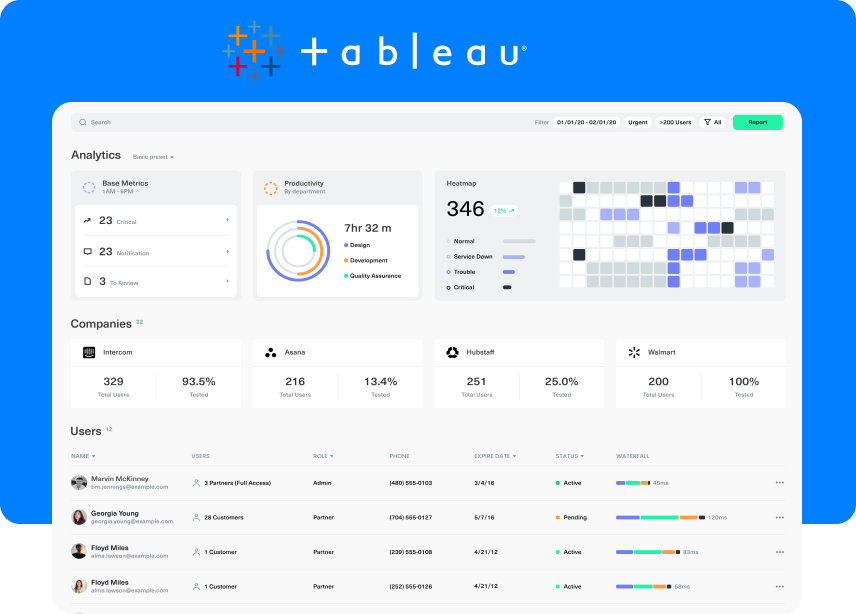
Tableau offers a wide range of visualization options to create interactive dashboards and reports. Users can choose from charts, graphs, tables, and maps to represent their data effectively.

The real-time data updates keep you in sync with the latest information, enabling you to make timely, data-driven decisions with confidence.

Tableau has robust geospatial capabilities, allowing users to create maps and analyze location-based data effectively. It supports custom geocoding and integration with mapping services like Mapbox and ESRI.

The mobile apps, for iOS and Android devices, enable users to access and interact with their data on the go.

A seamless integration with APIs streamlines the process of connecting and visualizing external data sources, enhancing your ability to harness and analyze a wide array of information with ease.

An effortless way to empower teams to work together seamlessly, fostering knowledge exchange and data-driven insights that drive better decision-making.
Tableau is focused on one thing: helping people see and understand data. Organizations everywhere-from non-profits to global enterprises, and across all industries and departments-are empowering their people with data.


Tableau helps people and organizations become more data-driven with the most beloved modern analytics platform in the world. Check our case studies to know more